
An employer 401(k) match may look modest on a single paycheck. A $69 employer contribution every two weeks does not immediately feel life-changing. Give those contributions 10, 20, or 30 years to compound, however, and the difference can become substantial.
Consider an employee earning 1,800 in matching contributions each year. Over 30 years, the employer deposits 170,029.
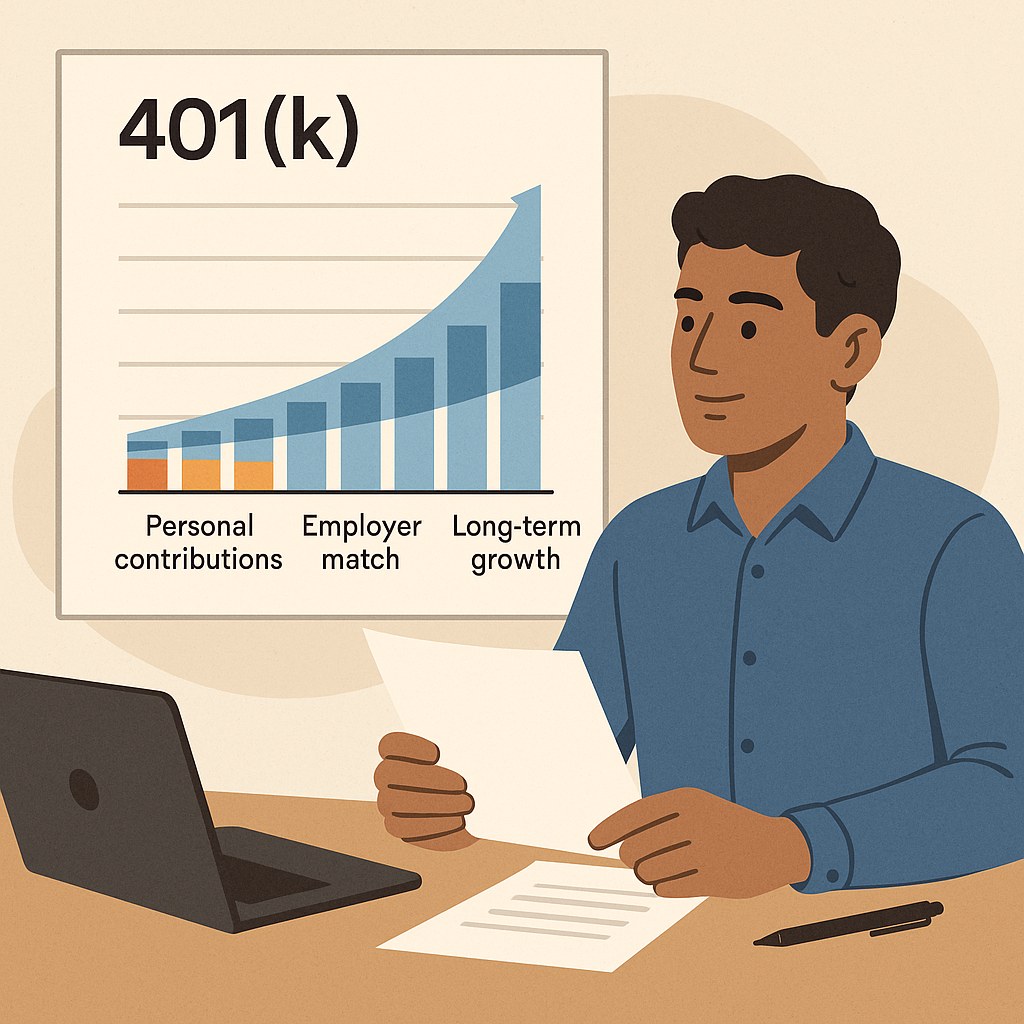
This guide separates the employee's contributions, the employer's match, and the investment growth so you can see where the projected balance comes from.
Key Takeaways
- A 50% match on the first 6% of salary equals a maximum employer contribution of 3% of salary.
- In the base example, the employee contributes 1,800.
- At an assumed 7% return, the employer match could account for approximately 73,792 after 20 years, and $170,029 after 30 years.
- The 30-year match-related balance consists of 116,029 in investment growth.
- Salary, contribution rate, matching formula, investment return, fees, and vesting can materially change the result.
- Employer contributions may be forfeited if you leave before becoming fully vested.
- All projections are educational estimates, not guaranteed investment outcomes.
How an Employer 401(k) Match Works
An employer match is a retirement contribution made by your employer based on the amount you contribute.
A matching formula might say:
The employer matches 50% of employee contributions on the first 6% of eligible compensation.
That does not mean the employer contributes 6% of salary. It means the employer contributes 50 cents for every dollar you contribute, stopping when your contribution reaches 6% of salary.
For someone earning $60,000:
The employee contributes $3,600 annually to reach the full matching threshold.
The employer contributes 50% of that amount:
The employee and employer therefore add a combined $5,400 to the account each year:
The employer's maximum contribution equals 3% of salary because:
The Formula for Calculating an Employer Match
You can reproduce the annual match with this formula:
Using the $60,000 example:
If the employee contributes only 4%:
If the employee contributes 10%, the employer still stops matching after the first 6%:
Contributing above the matching limit can still increase retirement savings, but it does not produce an additional match under this particular formula.
Assumptions Used in the Main Example
The projections in this article use the following assumptions:
| Assumption | Value |
|---|---|
| Annual salary | $60,000 |
| Salary growth | 0% |
| Employee contribution rate | 6% |
| Annual employee contribution | $3,600 |
| Employer matching percentage | 50% |
| Employer matching limit | First 6% of salary |
| Annual employer contribution | $1,800 |
| Combined annual contribution | $5,400 |
| Starting balance | $0 |
| Annual investment return | 7% |
| Investment fees | Not included |
| Contribution timing | End of each year |
| Inflation adjustment | Not included |
| Vesting | Fully vested |
| Withdrawals or loans | None |
The results are presented in nominal future dollars. They have not been adjusted for inflation, so the balances will not have the same purchasing power as an equal amount today.
The 7% return is an illustrative planning assumption. It is not a prediction, and actual investments can gain or lose value.
How the Investment Growth Is Calculated
The projections use the future value of a series of equal annual contributions:
Where:
- (FV) is the projected future value.
- (C) is the annual contribution.
- (r) is the assumed annual return.
- (n) is the number of years.
For the employee's $3,600 annual contribution over 30 years:
For the employer's $1,800 annual contribution:
The combined projected balance is:
Because the formula assumes contributions are made at the end of each year, it produces a slightly lower result than a calculation based on contributions from every paycheck.
Data Snapshot: 10-, 20-, and 30-Year Growth
The following table separates the money deposited by the employee, the money deposited by the employer, and the investment growth earned on each contribution source.
| Years | Employee contributions | Employer contributions | Growth on employee contributions | Growth on employer contributions | Total investment growth | Estimated ending balance |
|---|---|---|---|---|---|---|
| 10 | $36,000.00 | $18,000.00 | $13,739.21 | $6,869.61 | $20,608.82 | $74,608.82 |
| 20 | $72,000.00 | $36,000.00 | $75,583.77 | $37,791.89 | $113,375.66 | $221,375.66 |
| 30 | $108,000.00 | $54,000.00 | $232,058.83 | $116,029.42 | $348,088.25 | $510,088.25 |
The 30-year result can be checked with:
Of the projected $510,088 balance:
- $108,000 came directly from the employee.
- $54,000 came directly from the employer.
- Approximately $348,088 came from investment growth.
How Much Does the Employer Match Add?
The value of the match includes the employer's original deposits and the investment growth attributed to those deposits.
| Years | Employer deposits | Investment growth on employer deposits | Total balance attributable to the match |
|---|---|---|---|
| 10 | $18,000.00 | $6,869.61 | $24,869.61 |
| 20 | $36,000.00 | $37,791.89 | $73,791.89 |
| 30 | $54,000.00 | $116,029.42 | $170,029.42 |
The employer deposits 170,029 of the final balance under the stated assumptions.
In other words, the investment growth on the employer's money eventually becomes more valuable than the original employer contributions.
Balance With and Without the Match
The employee's own contribution remains the same in both scenarios. The only difference is whether the employer adds $1,800 annually.
| Years | Balance without employer match | Balance with employer match | Difference created by the match |
|---|---|---|---|
| 10 | $49,739.21 | $74,608.82 | $24,869.61 |
| 20 | $147,583.77 | $221,375.66 | $73,791.89 |
| 30 | $340,058.83 | $510,088.25 | $170,029.42 |
Under these assumptions, the employer match increases the projected 30-year balance by approximately 50% compared with the employee-only balance.
That relationship occurs because the employer contributes half as much as the employee each year, and both contribution streams receive the same assumed investment return.
Explore the Interactive Employer-Match Chart
Use the interactive chart below to try your own salary, contribution rate, employer match, investment return, fees, and savings period.
The chart separates:
- Employee contributions
- Employer contributions
- Investment growth
- Total projected balance
You can compare 10-, 20-, and 30-year outcomes or follow the estimated balance one year at a time. The assumptions used to generate the chart remain visible so that the result is not separated from the numbers behind it.
After creating a scenario, use Download CSV to save the year-by-year results or Share Chart to create a shareable version that preserves the selected assumptions.
Interactive projection
See what an employer match could add
Change the assumptions to compare your contributions with the projected value added by an employer match. Returns are estimates, not guarantees.
With employer match
$510,088
Without employer match
$340,059
Value added by match
$170,029
Contributions are modeled at the end of each year with no salary growth, starting balance, withdrawals, or inflation adjustment. The calculator applies 2026 contribution limits and subtracts the fee assumption from the annual return.
How Salary Changes the Value of the Match
A percentage-based employer match increases as eligible salary increases, provided the employee contributes enough to receive the full match.
The following scenarios assume:
- Employee contribution of 6%
- Employer match of 50% on the first 6%
- Constant salary
- 7% annual return
- End-of-year contributions
- No investment fees
- No starting balance
| Salary | Annual employee contribution | Annual employer match | 10-year balance | 20-year balance | 30-year balance |
|---|---|---|---|---|---|
| $40,000 | $2,400 | $1,200 | $49,739 | $147,584 | $340,059 |
| $60,000 | $3,600 | $1,800 | $74,609 | $221,376 | $510,088 |
| $100,000 | $6,000 | $3,000 | $124,348 | $368,959 | $850,147 |
The $100,000 scenario produces a larger balance because both the employee and employer contribute larger dollar amounts.
However, a higher salary does not automatically produce a larger balance. The employee must contribute, and the plan must treat the compensation as eligible for matching purposes. IRS and employer-plan limits can also restrict contributions.
How Different Matching Formulas Compare
Employer matching formulas can sound different while producing the same annual contribution.
For someone earning $60,000:
- A 50% match on the first 6% produces a $1,800 annual match.
- A 100% match on the first 3% also produces a $1,800 annual match.
The following table assumes the employee contributes 6%, or $3,600 per year, for 30 years at an annual return of 7%.
| Employer formula | Annual employee contribution | Annual employer contribution | Employee-related balance | Match-related balance | Combined 30-year balance |
|---|---|---|---|---|---|
| No match | $3,600 | $0 | $340,059 | $0 | $340,059 |
| 50% of first 6% | $3,600 | $1,800 | $340,059 | $170,029 | $510,088 |
| 100% of first 3% | $3,600 | $1,800 | $340,059 | $170,029 | $510,088 |
| 100% of first 6% | $3,600 | $3,600 | $340,059 | $340,059 | $680,118 |
The maximum dollar amount contributed by the employer is more important than how generous the formula initially sounds.
What Happens When You Do Not Reach the Full Match?
Suppose your employer matches 50% of the first 6% of your $60,000 salary.
| Employee contribution rate | Employee contribution | Employer match received | Available match not received |
|---|---|---|---|
| 2% | $1,200 | $600 | $1,200 |
| 4% | $2,400 | $1,200 | $600 |
| 6% | $3,600 | $1,800 | $0 |
| 8% | $4,800 | $1,800 | $0 |
| 10% | $6,000 | $1,800 | $0 |
At a 2% employee contribution, the employee receives only 1,800 match.
The missing $1,200 annual match could have grown to approximately:
That projected amount includes:
- $36,000 in employer contributions not received
- Approximately $77,353 in forgone investment growth
This does not mean someone should neglect rent, food, healthcare, emergency savings, or high-interest debt to capture a match. It shows the long-term tradeoff so the decision can be made with complete information.
How the Return Assumption Changes the Result
The assumed investment return has a significant effect, especially over 30 years.
The table below uses the same $5,400 combined annual contribution but changes the annual return.
| Annual return assumption | 10-year balance | 20-year balance | 30-year balance |
|---|---|---|---|
| 4% | $64,833 | $160,802 | $302,859 |
| 7% | $74,609 | $221,376 | $510,088 |
| 10% | $86,062 | $309,285 | $888,268 |
None of these outcomes is guaranteed.
The 10% result should not be treated as an expected outcome, and the 4% result is not a guaranteed minimum. Actual returns vary from year to year, losses are possible, and investment fees reduce the amount retained.
Testing several return assumptions is more responsible than building a retirement plan around one optimistic projection.
How Investment Fees Affect the Projection
The primary example uses a 7% return before accounting for fees.
If investments earn 7% before fees but the account incurs 0.50% in annual investment and administrative costs, the estimated net return becomes approximately 6.5%.
Using the same $5,400 annual contribution:
| Net annual return | 30-year estimated balance |
|---|---|
| 7.0% | $510,088 |
| 6.5% | $466,424 |
| 6.0% | $426,914 |
Even a relatively small annual fee can create a meaningful long-term difference because it reduces both the current balance and the future growth that balance could have earned.
Review the plan's fee disclosure and the expense ratios of the investments you select.
Contribution Limits Still Matter
For 2026, the basic employee elective-deferral limit for most 401(k) plans is 8,000.
A higher $11,250 catch-up limit applies to eligible participants ages 60 through 63 in 2026. (www.irs.gov)
Traditional and Roth employee contributions share the same elective-deferral limit. You do not receive a separate $24,500 limit for each account type.
Employer contributions do not reduce the employee elective-deferral limit, but employee and employer contributions are subject to a separate total-plan limit.
Current limits can be verified through the IRS retirement-plan contribution guidance.
Vesting Can Affect How Much of the Match You Keep
Your own 401(k) contributions and the associated investment earnings are always fully vested.
Employer contributions may vest:
- Immediately
- Gradually over several years
- After a specified number of years
If you leave the employer before becoming fully vested, you may forfeit part of the employer-funded balance.
The Department of Labor confirms that employees are fully vested in their own contributions, while employer matching contributions may be subject to a vesting schedule. (www.dol.gov)
The projections in this article assume full vesting. If you are only 60% vested, for example, you should not treat 100% of the employer-funded balance as yours.
Check your Summary Plan Description for the exact schedule.
Match Timing Can Also Change the Result
Some employers calculate the match separately for every paycheck.
If you contribute aggressively and reach the IRS limit before the end of the year, your contributions may stop during later pay periods. That could cause you to miss part of the employer match if the employer matches only when you contribute.
Some plans provide a year-end true-up that restores the missed match. Others do not.
Before front-loading contributions, confirm:
- Whether the match is calculated per paycheck
- Whether the plan provides a true-up
- Whether bonuses are eligible for matching
- Whether you must remain employed on a certain date
- When matching contributions are deposited
The Department of Labor describes the Summary Plan Description as the plain-language document explaining the plan's features and participants' rights and responsibilities. (www.dol.gov)
Can an Employer Change or Stop the Match?
An employer match is controlled by the plan's terms.
Depending on the plan type, an employer may be able to change, reduce, suspend, or discontinue future matching contributions. Safe harbor plans have specific contribution and notice requirements, while discretionary matching arrangements may give the employer more flexibility.
Watch for:
- Updated benefit notices
- Changes to the Summary Plan Description
- A Summary of Material Modifications
- Changes shown in the benefits portal
- Employer announcements about matching contributions
Do not assume that today's matching formula will remain unchanged for the next 10, 20, or 30 years.
Using Mortgage Easy App to Compare Employer-Match Scenarios
You can use the Mortgage Easy App 401(k) Employer Match Calculator after confirming your employer's matching formula.
Enter your salary, contribution percentage, employer match, matching limit, investment-return assumption, and projection period. The results separate the amount contributed by you, the amount contributed by your employer, and the estimated investment growth.
The interactive chart makes it easier to compare:
- Different salaries
- Partial and full matching contributions
- Alternative employer formulas
- 10-, 20-, and 30-year time horizons
- Conservative and optimistic return assumptions
- The effect of investment fees
You can then download the scenario as a CSV or share the chart while keeping the assumptions visible.
Mortgage Easy App does not administer your employer's retirement plan, verify your vesting schedule, select investments, or guarantee future returns. Use the results as educational estimates and confirm plan details with your employer or plan administrator.
Frequently Asked Questions
How much is a 50% match on the first 6%?
The maximum employer contribution equals 3% of eligible salary. For a 1,800 per year when the employee contributes at least 6%.
Does the employer match count toward my individual contribution limit?
Employer contributions do not use the employee elective-deferral limit. They do count toward the separate overall annual-additions limit covering eligible employee and employer contributions.
What if I cannot afford to contribute enough for the full match?
Choose a contribution that fits your budget. A partial employer match can still add value, and you can revisit the contribution after a raise or when another expense ends.
Is a 7% annual return guaranteed?
No. The 7% figure is an illustrative planning assumption. Actual investments can produce higher returns, lower returns, or losses.
Are these projected balances adjusted for inflation?
No. The main results are shown in nominal future dollars. Their future purchasing power will depend on inflation.
Methodology
Last updated: October 11, 2026
The primary estimates use the future value of an ordinary annuity. Equal contributions are assumed to occur at the end of each year.
The default calculation assumes:
- $60,000 annual salary
- No salary growth
- 6% employee contribution
- 50% employer match on the first 6%
- $3,600 annual employee contribution
- $1,800 annual employer contribution
- $5,400 total annual contribution
- 7% annual return
- Annual compounding
- No starting balance
- No withdrawals or loans
- No investment or administrative fees
- No inflation adjustment
- Full vesting
- No taxes applied to the ending balance
Employee and employer balances are calculated separately:
Total investment growth is calculated as:
The balance attributable to the employer match is calculated as:
Detailed values are rounded to the nearest cent. Comparison tables are rounded to the nearest dollar. Small differences may appear when another calculator assumes contributions occur monthly or with every paycheck.
For Publishers
Publishers may reference these estimates with optional attribution to Mortgage Easy App and a natural link to this article.
Mortgage Easy App Editorial Team. "How Much an Employer 401(k) Match Can Add Over 10, 20, and 30 Years." Mortgage Easy App. Updated October 11, 2026. View the original analysis
When quoting a calculated result, retain the applicable year, calculation assumptions, and last-updated date shown in the methodology.
Final Thoughts
In the base example, the employer contributes 170,029.
The number is useful, but the lesson is more important: a match should not be evaluated only by what appears on one paycheck. Its long-term value comes from both the employer's contributions and the years those contributions remain invested.
Before relying on a projection:
- Confirm the matching formula.
- Check the vesting schedule.
- Determine whether matching occurs per paycheck.
- Ask whether the plan offers a year-end true-up.
- Review investment and administrative fees.
- Compare several return assumptions.
- Confirm current IRS contribution limits.
- Recalculate when your salary or plan changes.
Use the Mortgage Easy App 401(k) Employer Match Calculator to test your own numbers, compare long-term scenarios, download the results, and share a chart with the assumptions kept in view.
All projections are educational estimates. Investment returns, employer contributions, plan provisions, tax rules, and future account values are not guaranteed.