
Updated October 13, 2026
It is easy to look at a 401(k) deduction on your paycheck and focus only on the money leaving your take-home pay. What is harder to see is what those contributions could become after years of employer contributions and investment growth.
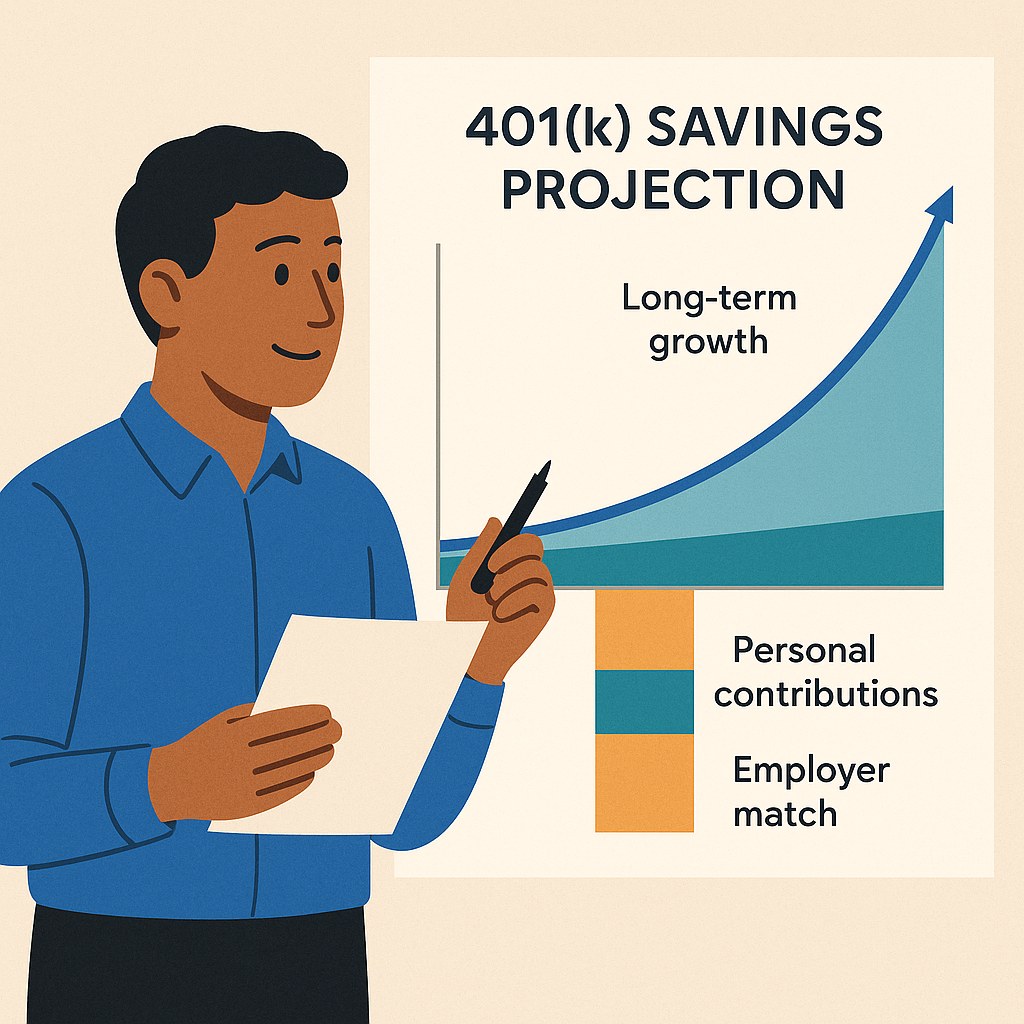
A 401(k) calculator makes that future value easier to visualize. It can separate what you contribute, what your employer contributes, and how much of the projected balance comes from investment growth.
Although people often call this “compound interest,” most 401(k) accounts hold investments rather than interest-paying savings accounts. Compound growth is usually the more accurate term because returns can include changes in investment value, dividends, and interest—and those returns are not guaranteed.
Key Takeaways
- Compound growth occurs when your investments potentially earn returns on both your contributions and earlier investment gains.
- Starting earlier gives each contribution more time to grow.
- Employer matching can increase both the amount deposited and the amount available to compound.
- A match described as “50% up to 6% of salary” does not mean the employer contributes 6%.
- Investment returns can be positive or negative, and a calculator cannot guarantee the final balance.
- Investment and administrative fees can reduce long-term growth.
- Your plan documents should be used to verify matching, vesting, contribution, and withdrawal rules.
How Compound Growth Works in a 401(k)
Suppose your account begins the year with $10,000 and earns a hypothetical 7% return.
After one year:
$10,000 × 1.07 = $10,700
If the account earns another 7% the following year:
$10,700 × 1.07 = $11,449
The second year’s $749 gain includes a return on the original $10,000 and on the previous year’s $700 gain.
A real 401(k) does not normally earn the same return every year. Its investments may gain or lose value. Calculators simplify this uncertainty by using an assumed average annual return.
Investor.gov describes compound growth as earning a return on the money invested and on the returns that money has already earned. Its compound interest calculator can be used to test general savings scenarios.
Reproducible 401(k) Example
Consider a fictional employee named Sarah.
Assume:
- Starting age: 30
- Retirement age: 65
- Annual salary: $60,000
- Employee contribution rate: 10%
- Annual employee contribution: $6,000
- Employer match: 50% of contributions up to 6% of salary
- Assumed annual return: 7%
- Starting balance: $0
- Salary growth: 0%
- Investment and administrative fees: Not included
- Contribution timing: End of each year
- Withdrawals and loans: None
- Employer contributions: Fully vested for illustration
Calculate Sarah’s contribution
$60,000 × 10% = $6,000 per year
Calculate the employer’s maximum match
The employer matches 50% of Sarah’s contributions, but only the first 6% of salary is eligible.
Maximum eligible contribution:
$60,000 × 6% = $3,600
Employer match:
$3,600 × 50% = $1,800
Sarah contributes more than 6%, but the employer match stops at $1,800.
Calculate the total annual deposit
$6,000 + $1,800 = $7,800
The original draft incorrectly calculated the employer contribution as $3,000. A 50% match on contributions up to 6% of a $60,000 salary produces a maximum employer contribution of $1,800, not $3,000.
The Compound-Growth Formula
For equal contributions deposited at the end of each year, the future value can be estimated using:
Future value = Annual contribution × [((1 + annual return) ^ years − 1) ÷ annual return]
For Sarah’s 35-year example:
- Annual contribution: $7,800
- Assumed return: 7%, or 0.07
- Number of years: 35
Future value = $7,800 × [((1.07)³⁵ − 1) ÷ 0.07]
Estimated ending balance:
Approximately $1,078,248
This result assumes a constant return and end-of-year contributions. Real contributions normally occur throughout the year, so a calculator using biweekly or monthly deposits may produce a somewhat different result.
Data Snapshot
The following table separates Sarah’s deposits, the employer’s deposits, and estimated investment growth.
| Time invested | Employee contributions | Employer contributions | Estimated investment growth | Estimated ending balance |
|---|---|---|---|---|
| 10 years | $60,000 | $18,000 | $29,768 | $107,768 |
| 20 years | $120,000 | $36,000 | $163,765 | $319,765 |
| 30 years | $180,000 | $54,000 | $502,794 | $736,794 |
| 35 years | $210,000 | $63,000 | $805,248 | $1,078,248 |
Figures are rounded to the nearest dollar. The calculation assumes a 7% annual return, end-of-year contributions, no salary growth, no withdrawals, and no investment fees.
After 35 years, Sarah and her employer would have deposited a combined $273,000. The remaining $805,248 represents estimated investment growth under the assumptions used.
That does not mean the investment account will actually earn 7% every year. The table is a planning illustration, not a forecast.
How Employer Matching Changes Long-Term Growth
The employer match does more than add $1,800 each year. Each employer deposit also has an opportunity to earn investment returns.
Under the same 35-year and 7% assumptions:
| Source | Amount deposited | Estimated value after growth |
|---|---|---|
| Employee contributions | $210,000 | $829,421 |
| Employer contributions | $63,000 | $248,826 |
| Combined balance | $273,000 | $1,078,248 |
The employer deposits total $63,000, but their estimated future value is approximately $248,826 because earlier deposits have decades to compound.
Employer contributions should still be treated as conditional compensation rather than unrestricted “free money.” Matching eligibility, contribution timing, and vesting can determine how much you receive and keep.
What Different Contribution Rates Could Produce
Using Sarah’s $60,000 salary and the same employer formula, the following table compares several employee contribution rates.
| Employee contribution rate | Annual employee contribution | Annual employer contribution | Estimated balance after 30 years |
|---|---|---|---|
| 3% | $1,800 | $900 | $255,044 |
| 6% | $3,600 | $1,800 | $510,088 |
| 10% | $6,000 | $1,800 | $736,794 |
| 15% | $9,000 | $1,800 | $1,020,176 |
All scenarios assume a 7% annual return, end-of-year contributions, no salary changes, and no fees.
At a 3% contribution rate, Sarah receives only half of the available employer match. At 6%, she receives the full $1,800.
Increasing her contribution above 6% does not increase the employer match under this formula, but it increases the amount of her own money invested.
Different Salary and Employer-Match Scenarios
The value of a match changes with salary and plan design. The following scenarios assume each employee contributes 10% of salary and receives a 50% match on contributions up to 6% of salary.
| Annual salary | Annual employee contribution | Annual employer contribution | Estimated balance after 30 years |
|---|---|---|---|
| $50,000 | $5,000 | $1,500 | $613,995 |
| $75,000 | $7,500 | $2,250 | $920,993 |
| $100,000 | $10,000 | $3,000 | $1,227,990 |
The examples assume a 7% annual return, no salary growth, no fees, and end-of-year contributions.
These figures do not suggest how much any particular person should contribute. They demonstrate how salary-based contributions and matching formulas affect long-term projections.
Why the Return Assumption Matters
A calculator’s result can change dramatically when you adjust the expected return.
Using Sarah’s $7,800 annual contribution over 30 years:
| Assumed annual return | Total contributions | Estimated investment growth | Estimated ending balance |
|---|---|---|---|
| 5% | $234,000 | $284,223 | $518,223 |
| 7% | $234,000 | $502,794 | $736,794 |
| 9% | $234,000 | $829,199 | $1,063,199 |
The difference between the 5% and 9% projections is approximately $544,976. That is why a calculator should display its return assumption clearly.
A higher assumed return creates a larger projection, but it does not make that return more likely. Consider testing a range of returns instead of relying on one optimistic result.
Explore the Interactive 401(k) Chart
Use the interactive chart to replace the illustrative assumptions with information from your own retirement plan.
Adjust:
- Current salary or hourly pay
- Employee contribution percentage
- Employer match percentage
- Percentage of salary eligible for matching
- Current 401(k) balance
- Expected salary growth
- Years until retirement
- Assumed annual return
- Estimated annual fees
The chart separates:
- Employee contributions
- Employer contributions
- Estimated investment growth
- Total projected balance
Compare the 10-, 20-, and 30-year views to see when investment growth begins contributing more to the projected balance than new deposits.
Select Download CSV to save the annual results for further analysis. Select Share Chart to create a shareable version that retains the assumptions used.
Any downloaded or shared result should include the assumed return, contribution timing, salary growth, fees, and calculation date. Without that context, a projection can easily be mistaken for a guaranteed outcome.
Using Public 401(k) Calculators
Before relying on any calculator, check which inputs and assumptions it supports.
A useful 401(k) calculator should allow you to enter:
- Current balance
- Contribution amount or percentage
- Employer matching formula
- Salary
- Salary growth
- Years until retirement
- Expected return
- Investment or plan fees
- Contribution frequency
Some general compound-growth calculators treat employee and employer deposits as one combined contribution. That can estimate a total balance, but it does not show whether you are contributing enough to receive the full employer match.
When comparing results from two calculators, make sure they use the same:
- Contribution timing
- Compounding frequency
- Return assumption
- Salary-growth assumption
- Fee assumption
- Employer-match formula
A monthly calculator and an end-of-year calculator can produce different balances even when the annual contribution is the same.
Testing a Scenario With Mortgage Easy App
After reviewing your plan documents, the Mortgage Easy App 401(k) Employer Match Calculator provides another way to compare employee contributions and employer matching.
For an employer formula written as “50% of contributions up to 6% of salary,” enter:
- Employer match rate: 50%
- Maximum salary percentage eligible for matching: 6%
Do not enter 6% as the amount contributed by the employer. Under this formula, the maximum employer contribution is 3% of salary.
The calculator can help illustrate how changes in salary, contribution rate, employer match, time, and expected return affect the estimated balance. The result remains an educational projection. Your employer’s plan document controls the actual matching and vesting rules.
How Vesting Affects the Employer Balance
Vesting determines how much of the employer-funded portion you are entitled to keep if you leave the company.
Your own employee contributions are always 100% vested. Employer contributions may:
- Vest immediately
- Become fully vested after a specified period
- Vest gradually over several years
Suppose your account includes $12,000 in employer contributions, but you are only 60% vested. Your vested employer balance would be:
$12,000 × 60% = $7,200
You could potentially forfeit the remaining $4,800 if you left before becoming fully vested, depending on the plan’s rules.
Review the IRS guidance on retirement-plan vesting and your Summary Plan Description for the schedule that applies to you.
2026 Contribution Limits
For 2026, the employee elective-deferral limit for most 401(k) plans is $24,500.
Eligible participants age 50 or older can generally make an additional $8,000 catch-up contribution. A higher $11,250 catch-up limit applies to eligible participants ages 60 through 63.
The total annual-additions limit—which generally includes employee deferrals, employer matching contributions, employer nonelective contributions, and certain other additions—is the lesser of:
- 100% of compensation, or
- $72,000 for 2026, excluding eligible catch-up contributions
Contribution limits can change each year. Confirm current figures through the IRS 401(k) contribution-limit guidance.
How Fees Affect Compound Growth
Investment and administrative fees reduce the amount left in the account to compound.
Fees may include:
- Investment expense ratios
- Plan administration fees
- Individual service fees
- Advisory or managed-account fees
Even a small annual fee can create a meaningful difference over several decades. Review your plan’s participant fee disclosure and investment information instead of assuming the calculator’s return is net of fees.
The U.S. Department of Labor provides additional guidance in Understanding Your Retirement Plan Fees.
Inflation and Purchasing Power
A future balance of $1 million will not have the same purchasing power as $1 million today.
One way to account for inflation is to use a real return:
Approximate real return = Investment return − inflation rate
If the assumed investment return is 7% and inflation averages 2.5%, a simplified real-return estimate would be approximately 4.5%.
This subtraction is useful for quick planning, but the more precise formula is:
Real return = [(1 + investment return) ÷ (1 + inflation rate)] − 1
Using 7% investment growth and 2.5% inflation:
[(1.07 ÷ 1.025) − 1] × 100 = approximately 4.39%
A calculator should clearly state whether it displays future dollars or inflation-adjusted dollars.
Market Volatility and Calculator Limitations
A constant-return calculator creates a smooth growth line. Real investment returns do not behave that way.
A 7% assumption does not mean the account will gain 7% every year. One year may produce a gain, another may produce a loss, and the sequence of those returns can affect the final balance.
A calculator also cannot know:
- Future market returns
- How long you will remain with an employer
- Whether the employer will change its match
- Future contribution limits
- Future tax laws
- Whether you will borrow or withdraw from the plan
- How your salary will change
- Your future investment allocation
- Your actual retirement spending needs
Use the result to compare scenarios, not to predict an exact retirement balance.
Balancing Retirement Contributions and Current Needs
Capturing the full available employer match can be a useful starting point, but retirement contributions should not leave you unable to cover essential expenses.
Before increasing your contribution, consider:
- Emergency savings
- High-interest debt
- Housing and childcare costs
- Health expenses
- The effect on take-home pay
- Employer-match and vesting rules
- Investment fees
- Other short- and long-term goals
There is no contribution percentage that works for everyone. A sustainable rate that you can increase gradually may be more practical than an aggressive rate that forces you to stop contributing later.
Early Withdrawals and Loans
A withdrawal removes money that would otherwise remain invested and potentially compound.
A taxable 401(k) distribution taken before age 59½ may also be subject to an additional 10% federal tax unless an exception applies. Income taxes may apply as well. Review the IRS 401(k) distribution rules before taking a distribution.
A 401(k) loan is different from a withdrawal, but it can still affect long-term growth. Loan availability, repayment requirements, and consequences after leaving employment depend on the plan.
How to Verify Your Calculator Inputs
Before relying on a projection:
- Read your Summary Plan Description.
- Confirm the employer’s exact matching formula.
- Check your contribution rate on a recent pay statement.
- Review the vested and unvested portions of your balance.
- Confirm whether matching occurs per paycheck.
- Find out whether the plan provides a year-end true-up.
- Review investment and administrative fees.
- Check whether the calculator assumes monthly, biweekly, or annual deposits.
- Run several return scenarios instead of relying on one result.
- Compare the projection with your official account statement.
Frequently Asked Questions
What percentage should I contribute to my 401(k)?
There is no universal percentage that works for everyone. A practical first step is to determine how much you must contribute to receive the full available employer match. From there, consider your income, expenses, emergency savings, debt, retirement timeline, and applicable contribution limits.
Does my employer match count toward my employee limit?
No. Employer contributions do not count toward the employee elective-deferral limit. They generally count toward the separate annual-additions limit.
Can I change my contribution rate at any time?
Many plans allow contribution changes during the year, but the timing and frequency depend on the plan. Some changes may take one or more payroll periods to appear. Confirm the procedure with your employer or plan administrator.
Are 401(k) returns guaranteed?
No. The account’s performance depends on its investments, fees, and market conditions. Calculator results are hypothetical estimates.
Does starting earlier really make a major difference?
Starting earlier gives each contribution more time to compound. Someone who begins later may need to contribute more each year to pursue the same projected balance.
What happens to my employer match if I change jobs?
You keep your own contributions. Whether you keep all employer contributions depends on the plan’s vesting schedule. You may forfeit the unvested portion when you leave.
Methodology
Last updated: October 13, 2026
The primary example assumes:
- Starting balance of $0
- Annual salary of $60,000
- Employee contribution rate of 10%
- Annual employee contribution of $6,000
- Employer match of 50% on contributions up to 6% of salary
- Annual employer contribution of $1,800
- Total annual contribution of $7,800
- Contributions deposited at the end of each year
- Constant 7% annual investment return
- No salary growth
- No withdrawals or loans
- No taxes, inflation, investment fees, or administrative fees
- Employer contributions fully vested
- Values rounded to the nearest dollar
The projections use:
Future value = Annual contribution × [((1 + annual return) ^ years − 1) ÷ annual return]
Employee and employer projections were calculated separately. Estimated investment growth equals the projected ending balance minus cumulative employee and employer deposits.
The return comparison uses the same $7,800 annual contribution and substitutes 5%, 7%, and 9% annual return assumptions. These assumptions illustrate sensitivity and are not predictions.
Sources
- Internal Revenue Service: 401(k) limit increases to $24,500 for 2026
- Internal Revenue Service: 401(k) and profit-sharing plan contribution limits
- Internal Revenue Service: Retirement-plan vesting
- Internal Revenue Service: 401(k) distribution rules
- Investor.gov: Compound Interest Calculator
- Investor.gov: Introduction to investing
- U.S. Department of Labor: Understanding Your Retirement Plan Fees
For Publishers
Publishers may reference these illustrative calculations with optional attribution to Mortgage Easy App and a natural link to this article.
Mortgage Easy App Editorial Team. “401(k) Compound Interest Calculator: How Retirement Savings Grow Over Time.” Mortgage Easy App. Updated October 13, 2026. View the original analysis.
When quoting a calculated result, retain the salary, employee contribution, employer-match formula, assumed return, time period, contribution timing, and last-updated date shown in the methodology.
Final Thoughts
A 401(k) calculator is most useful when it shows where the projected balance comes from. Separating employee contributions, employer contributions, and investment growth prevents an optimistic total from hiding unrealistic assumptions.
Begin with your employer’s actual matching and vesting rules. Then compare several contribution and return scenarios using a public compound-growth calculator or the Mortgage Easy App 401(k) Employer Match Calculator.
The objective is not to predict an exact retirement balance. It is to understand how your contribution rate, employer match, time, fees, and assumed investment growth can change the range of possible outcomes.
Educational Disclaimer
This article provides general educational information and does not constitute financial, investment, tax, or legal advice. Investment returns are not guaranteed, and actual results may differ materially from the illustrations. Verify contribution limits, matching rules, vesting provisions, fees, withdrawal rules, and tax consequences with the IRS, your employer, your plan administrator, or another qualified professional before making a financial decision.